What is Practice Expense (PE) in Medicare Reimbursement?
Practice Expense (PE) is one of the three core components of a service’s Relative Value Unit (RVU) within the Medicare Physician Fee Schedule (MPFS). It represents the overhead and operating costs associated with delivering medical services—everything other than physician time or malpractice coverage.
The PE component captures the real-world expenses of running a practice, including clinical staff wages, medical supplies, rent, utilities, administrative labor, and equipment depreciation. CMS uses extensive cost-survey data to determine PE values and adjust them by region using the Geographic Practice Cost Index (GPCI) before converting them into dollar amounts via the Conversion Factor (CF).
Formula Context:
Payment = [(Work RVU × Work GPCI) + (PE RVU × PE GPCI) + (MP RVU × MP GPCI)] × Conversion Factor
In this formula, the Practice Expense RVU often contributes the largest share of the total reimbursement—particularly for facility-based and technology-intensive services. Because it directly reflects practice overhead, PE is central to CMS’s effort to ensure that reimbursement aligns with the true cost of care delivery across diverse clinical settings.
Key Components of the Medicare Practice Expense (PE)
The Practice Expense (PE) portion of a Relative Value Unit (RVU) represents the non-physician costs associated with providing medical services under the Medicare Physician Fee Schedule (MPFS). CMS divides these costs into direct and indirect categories to reflect both the visible operational inputs (e.g., staff and supplies) and hidden overhead elements (e.g., rent and administration).
Practice Expense values are derived from cost survey data, time studies, and equipment utilization models, ensuring that payment rates accurately capture the economic burden of maintaining a medical practice.
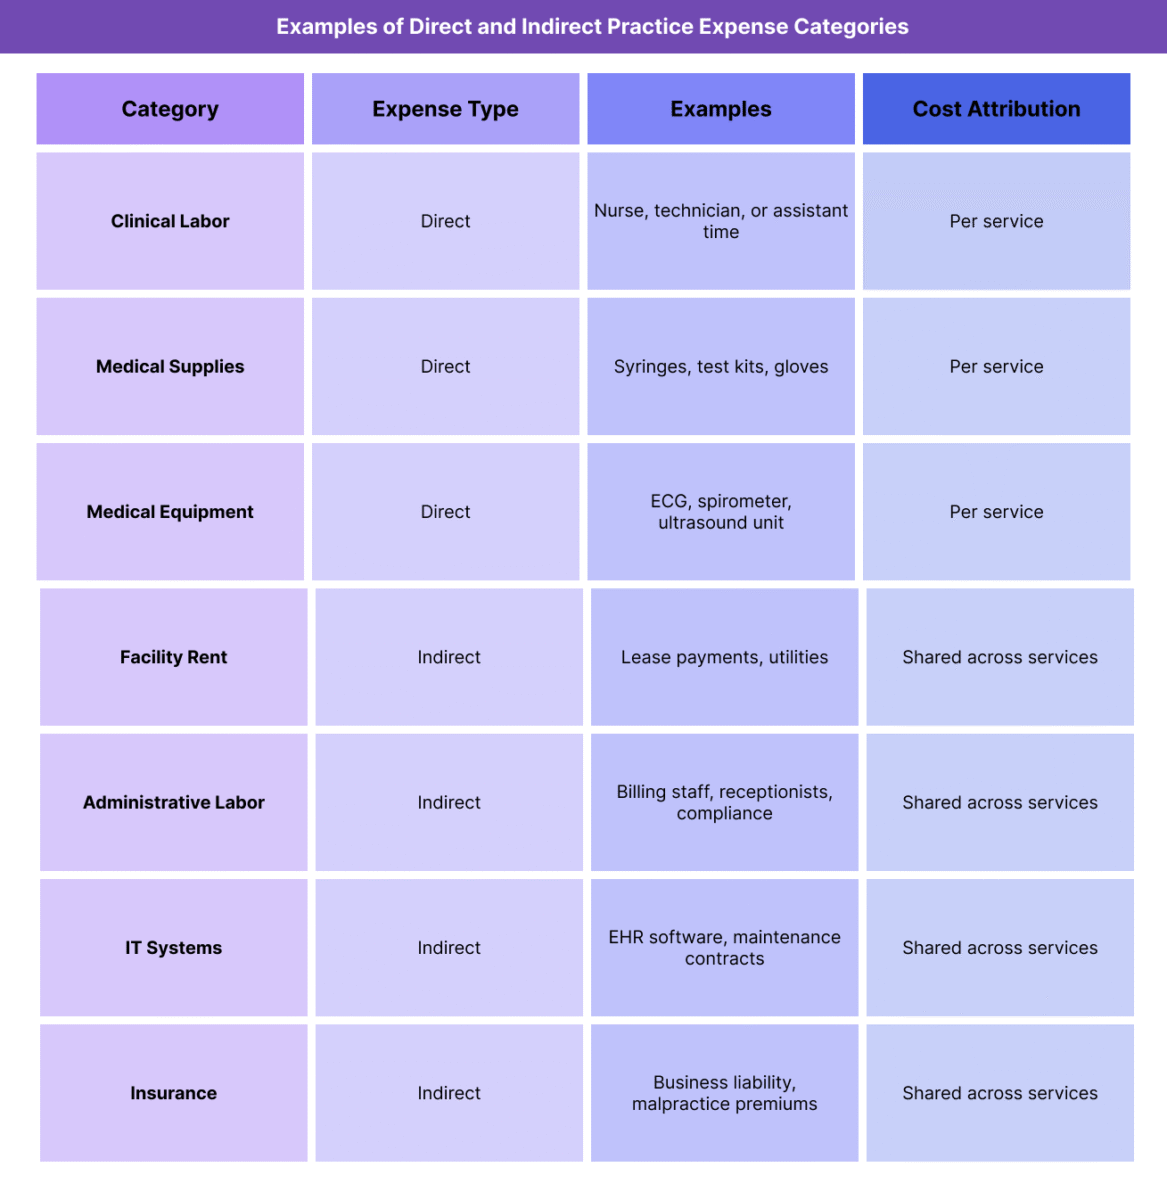
1. Direct Practice Expenses
Direct expenses are the resources used at the point of care to deliver a specific service or procedure.
They include:
- Clinical labor (e.g., nurses, medical assistants, technicians)
- Medical supplies (e.g., syringes, bandages, testing kits)
- Medical equipment (e.g., ECG machines, exam tables, diagnostic tools)
Direct costs are assigned at the procedure level, meaning that services requiring more staff time or specialized equipment receive higher direct PE RVUs.
2. Indirect Practice Expenses
Indirect expenses reflect the overhead and administrative costs that support the entire operation but aren’t tied to a specific procedure.
They include:
- Office rent and utilities
- Billing and administrative staff salaries
- IT systems and EHR maintenance
- Non-clinical supplies
- General liability insurance and compliance costs
Indirect costs are allocated proportionally across all services, based on workload and specialty-specific survey data.
3. Data Sources and Allocation Methodology
- CMS uses data from the AMA Physician Practice Information Survey (PPIS) and other validated cost studies.
- Practice Expense inputs are regularly updated to reflect changes in equipment pricing, labor markets, and practice structure.
- Indirect expenses are distributed using a “pooling” method, where total indirect costs are weighted according to each service’s share of total direct costs.
- PE values are then adjusted for regional cost variation using the Practice Expense GPCI before applying the Conversion Factor (CF).
4. Why Practice Expense Matters
- PE accounts for roughly 45%–50% of total RVU value for most services.
- It ensures that reimbursement reflects the true cost of operating a clinical environment, not just provider effort.
- For technology-heavy or equipment-dependent specialties, PE weighting is a key driver of payment adequacy.
- Periodic CMS updates to PE methodology directly influence practice sustainability and capital investment decisions across all care settings.
How Practice Expense (PE) Works in Practice
The Practice Expense (PE) component is central to how CMS (Centers for Medicare & Medicaid Services) translates operational costs into reimbursement under the Medicare Physician Fee Schedule (MPFS). It connects economic reality—what it costs to run a practice—to the Relative Value Unit (RVU) system that drives payment formulas.
Understanding how PE is applied in practice helps both administrators and billing teams forecast Medicare revenue, allocate overhead, and evaluate the true financial impact of cost changes within their organizations.
Step 1: CMS Collects and Updates Practice Cost Data
- CMS gathers practice cost data through surveys, including the AMA Physician Practice Information Survey (PPIS) and supplemental specialty-specific studies.
- Data include labor, supply, rent, and equipment costs, reflecting variations in practice type, size, and region.
- CMS updates cost inputs periodically, often every few years, to align with inflation trends and structural shifts in healthcare delivery.
Step 2: Assign Direct and Indirect Costs to Each Procedure
- Each CPT or HCPCS code is mapped to a specific set of direct costs (e.g., staff time, supplies, equipment).
- Indirect costs are pooled and allocated proportionally across all procedures, using weighted formulas that account for relative workload and resource use.
- This process ensures that each service’s PE RVU reflects both its unique procedural demands and its share of the practice’s overall overhead.
Step 3: Adjust for Geographic Variation
- After determining national PE RVUs, CMS applies the Practice Expense GPCI (Geographic Practice Cost Index) to adjust for regional cost differences.
- For example, a clinic in San Francisco may have higher rent and wages than one in Omaha; GPCI ensures payments align with those realities.
- This adjustment prevents underpayment in high-cost regions and overpayment in lower-cost markets.
Step 4: Apply the Conversion Factor (CF)
Once the PE RVUs (adjusted for geography) are finalized, they are multiplied by the Conversion Factor (CF) to determine the final payment amount for each procedure.
Example:
PE RVU = 2.50
PE GPCI = 1.08
CF = $32.31
Payment contribution = 2.50 × 1.08 × $32.31 = $87.64
This portion of the payment is combined with the Work RVU and Malpractice RVU to yield total reimbursement.
Step 5: Integration in Practice Operations and Forecasting
- Billing teams and financial analysts use PE data to model expected reimbursement and determine whether service lines are profitable under current Medicare rates.
- Administrators use PE benchmarks for budgeting, cost control, and capital planning, ensuring operational efficiency aligns with reimbursement potential.
- CMS analysts monitor aggregate PE trends to evaluate cost inflation and practice sustainability across the U.S. healthcare system.
Step 6: Practice Expense and Policy Alignment
- PE methodology supports value-based care initiatives by capturing the full scope of care delivery costs, including infrastructure and technology investments.
- Accurate PE measurement helps ensure that practices are fairly compensated for maintaining the facilities and systems that enable quality care—particularly in outpatient and small-practice settings.
PE Billing, Reimbursement, and System Limitations
The Practice Expense (PE) component plays a decisive role in shaping Medicare reimbursement because it reflects the actual cost of running a clinical practice. In most cases, PE accounts for nearly half of a service’s Relative Value Unit (RVU) total—making it a key determinant of payment adequacy.
Despite its intent to balance fairness and accuracy, the PE system faces methodological and policy challenges that can skew reimbursement, particularly for smaller, rural, or resource-intensive practices.
How PE Affects Reimbursement
- PE represents the largest portion of total RVUs for most outpatient and office-based services.
- High-cost specialties—such as radiology, cardiology, and oncology—depend heavily on PE valuation accuracy, since equipment and facility costs dominate their operations.
- Conversely, cognitive specialties (e.g., psychiatry, geriatrics, primary care) are less PE-weighted, meaning that most of their reimbursement derives from the Work RVU component.
- Because PE is subject to both GPCI geographic adjustments and the Conversion Factor (CF), even small methodology shifts can produce significant payment swings across service lines.
Cost Distribution and Weighting Limitations
- CMS relies on cost survey data (such as the PPIS) that may not fully represent the diversity of modern practices, particularly smaller or technology-enabled clinics.
- The indirect cost pooling method—where shared overhead is distributed based on direct cost ratios—can disproportionately favor procedural services that require high direct resource use.
- Fixed weighting formulas may underestimate administrative and IT costs, especially as electronic health record (EHR) maintenance and compliance burdens rise.
- Because PE inputs are not updated annually, lagging cost data can distort current reimbursement levels.
Geographic and Setting Disparities
- The Practice Expense GPCI attempts to normalize costs across markets but cannot fully capture sub-regional variations (e.g., rural clinics within high-cost states).
- Freestanding clinics, Rural Health Clinics (RHCs), and Critical Access Hospitals (CAHs) often experience mismatch between their real overhead and the standardized PE assumptions used in the MPFS.
- Facility- and non-facility-based PE values can differ dramatically, sometimes incentivizing site-of-service shifts rather than efficiency gains.
- Inflation and Policy Constraints
- While PE values are intended to track real-world costs, they are indirectly constrained by the Conversion Factor (CF) and budget neutrality rules.
- Even when equipment, supply, or wage costs rise sharply, total Medicare spending cannot increase without offsets elsewhere.
- This means that PE-driven inflation is often suppressed, reducing payment adequacy and limiting the ability of small practices to absorb rising overhead.
Administrative Challenges and Reform Needs
- Stakeholders have called for CMS to modernize PE methodology by:
- Incorporating real-time cost data through updated national surveys.
- Adjusting for digital infrastructure and compliance costs that were minimal when current models were designed.
- Creating dynamic indirect-cost weighting formulas responsive to practice type and specialty.
- Such updates would improve payment accuracy, fairness, and sustainability across Medicare’s provider base.
Broader Payment System Implications
- Because commercial payers and Medicaid programs often mirror Medicare’s RVU and PE structures, any inaccuracies in PE calculations cascade across the healthcare system.
- Under-representation of true operating costs can drive practice consolidation, reduced access, and geographic inequities.
- Accurate PE valuation is essential to maintaining a balanced, competitive, and equitable reimbursement ecosystem.
PE and Its Impact on Quality, Access, and Health Equity
The Practice Expense (PE) component of Medicare reimbursement has far-reaching effects on care quality, practice sustainability, and equity of access. Because PE defines how non-clinical operating costs are valued and reimbursed, it directly shapes a provider’s ability to invest in staff, equipment, and infrastructure—core drivers of safe and effective care.
Linking Practice Costs to Care Quality
- PE determines how adequately reimbursement supports the physical and operational backbone of clinical care: facilities, supplies, and technology.
- Practices that are fairly reimbursed for overhead can maintain equipment calibration, infection-control standards, and patient-safety systems.
- When PE valuations lag behind real costs, clinics may defer upgrades or reduce staffing, leading to downstream impacts on care reliability and patient outcomes.
Influence on Workforce and Service Distribution
- Because indirect PE covers administrative and support staff, underestimation of these costs constrains a clinic’s ability to retain qualified personnel.
- Low PE reimbursement disproportionately affects primary-care, behavioral-health, and community practices that rely on smaller volumes and have thinner margins.
- Over time, this creates workforce maldistribution, pushing providers toward high-margin specialties or facility-based employment models.
Rural and Underserved Area Effects
- In rural or frontier regions, real operating costs (e.g., supply shipping, utilities, broadband for EHR access) often exceed national PE assumptions.
- Limited GPCI granularity means many rural practices are under-adjusted, receiving payments that fail to cover true overhead.
- This under-reimbursement contributes to clinic closures, limited specialty availability, and care deserts, undermining Medicare’s access-equity goals.
Technology and Quality-of-Care Gaps
- PE valuations heavily influence investment in health-IT systems, telehealth infrastructure, and diagnostic equipment.
- When CMS under-indexes PE for technology costs, smaller practices face barriers to adopting modern tools—reducing participation in value-based care and data-driven quality reporting programs.
- Larger systems can absorb these expenses more easily, widening the digital divide in care quality.
Policy Considerations for Equity and Sustainability
- To strengthen equity, policymakers have proposed:
- Dynamic PE weighting that reflects specialty-specific overhead pressures.
- Rural and small-practice adjustment factors that recognize sub-regional cost differences.
- Inclusion of social-risk and community-access indicators in PE modeling to align reimbursement with health-equity objectives.
- Modernizing PE methodology would help ensure that all providers—regardless of size or location—can maintain the infrastructure necessary for high-quality, equitable care delivery.
Balancing Efficiency with Access
- CMS’s challenge lies in balancing cost control with access protection.
- A more responsive PE model would reduce payment distortions, stabilize small-practice economics, and enhance participation in preventive and coordinated-care initiatives.
- Ultimately, aligning PE reimbursement with true practice costs supports the triple aim of healthcare: better quality, improved access, and sustainable spending.
Frequently Asked Questions about the Practice Expense (PE)
1. What is Practice Expense (PE) in Medicare reimbursement?
The Practice Expense (PE) represents the non-physician costs of operating a medical practice under the Medicare Physician Fee Schedule (MPFS). It includes the overhead expenses required to deliver care—such as staff wages, medical supplies, rent, and utilities—and is one of the three components of a Relative Value Unit (RVU), along with Work RVU and Malpractice RVU.
2. How is Practice Expense calculated?
CMS calculates PE by analyzing direct and indirect costs collected from national surveys such as the AMA Physician Practice Information Survey (PPIS).
- Direct costs include clinical labor, supplies, and equipment used for a specific procedure.
- Indirect costs include administrative labor, facility rent, IT systems, and utilities.
These costs are then weighted, geographically adjusted using the Practice Expense GPCI, and multiplied by the Conversion Factor (CF) to determine the final payment amount.
3. What is the difference between direct and indirect Practice Expense?
- Direct PE: Resources used directly in providing a service (e.g., staff time, syringes, ECG machines).
- Indirect PE: Overhead and administrative costs that support all services (e.g., rent, billing staff, IT systems).
CMS uses both to ensure reimbursement reflects the total operational burden of running a medical practice.
4. Why does Practice Expense vary by region?
Practice Expense values are adjusted using the Geographic Practice Cost Index (GPCI) to account for regional differences in labor and facility costs. For example, rent and wages in San Francisco are much higher than in rural Kansas, so PE payments are adjusted upward to maintain fairness across locations.
5. How often does CMS update Practice Expense data?
CMS periodically updates PE data when new cost surveys or economic data become available. While the Medicare Economic Index (MEI) tracks inflation annually, PE methodology updates often occur every 3–5 years through the MPFS rulemaking process. Updates may lag behind current market trends, creating reimbursement gaps during high inflation periods.
6. How does Practice Expense affect physician reimbursement?
PE can account for 45%–50% of total RVU-based payment, making it one of the largest determinants of Medicare reimbursement. For high-overhead specialties like radiology or cardiology, even small PE changes can significantly impact total payment rates and practice sustainability.
7. Why is Practice Expense important for healthcare equity and sustainability?
Accurate PE valuation ensures that practices in rural, small, and underserved communities receive fair reimbursement that reflects their true operating costs. When PE underestimates real expenses, it can lead to practice closures, reduced access, and workforce shortages—undermining Medicare’s goals of equitable care delivery.
